Difference between revisions of "BIPS/Performance"
| Line 23: | Line 23: | ||
== Results == | == Results == | ||
| + | |||
| + | Here we plot the Frame Rate, Bandwidth and Latency as a function of the number of buffers we use in each test. Each test runs for at least 100 iterations. The metrics are then averaged across the different iterations. | ||
| + | |||
| + | === Using 4 byte Buffers === | ||
| + | |||
| + | To reduce the Processing and Inter Iteration overhead, we exchange small, 4 byte Buffers. | ||
[[File:Fps minsize.png| center | 500 px ]] | [[File:Fps minsize.png| center | 500 px ]] | ||
| + | [[File:Bw minsize.png| center | 500 px ]] | ||
| + | [[File:Latency minsize.png| center | 500 px ]] | ||
| + | |||
| + | == Using 4K RGBA Buffers === | ||
| + | |||
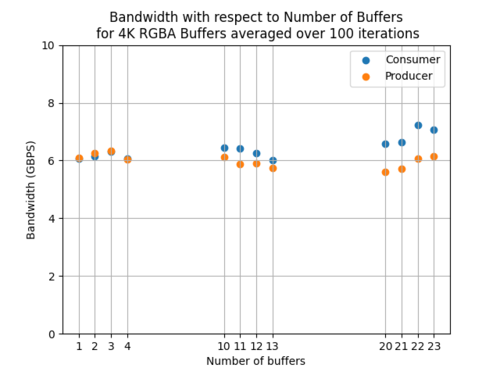
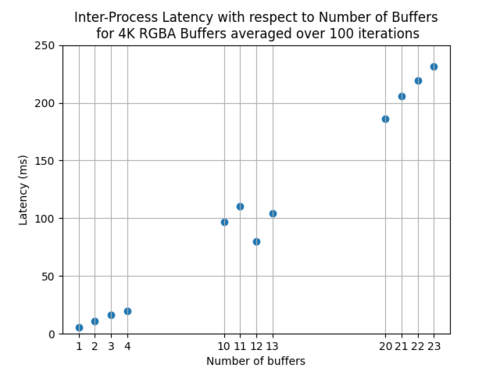
| + | To simulate a relatively demanding use case, we exchange 4K RGBA Buffers. | ||
| + | |||
[[File:Fps 4k rgba.png| center | 500 px ]] | [[File:Fps 4k rgba.png| center | 500 px ]] | ||
| − | |||
[[File:Bw 4k rgba.png| center | 500 px ]] | [[File:Bw 4k rgba.png| center | 500 px ]] | ||
| − | |||
[[File:Latency 4k rgba.png| center | 500 px ]] | [[File:Latency 4k rgba.png| center | 500 px ]] | ||
Revision as of 12:31, 30 December 2022
| Buffer Interprocess Sharing | |
|---|---|
 | |
| BIPS Basics | |
|
|
|
| Getting Started | |
|
|
|
| User Manual | |
|
|
|
| Examples | |
|
|
|
| Performance | |
|
|
|
| Contact Us | |
|
|
Contents
Introduction
To evaluate BIPS' performance, we measure Frame Rates, Bandwidths and Latencies under different conditions. We use the provided example binaries to obtain these measurements, please refer to BIPS/Examples/C++ for more information.
The following diagram illustrates the basic timing when running a producer process in parallel with a consumer process.
Frame Rate
We measure the Frame Rate in Frames Per Second (FPS) as the number of production or consumption cycles a client completes in a second. Notice that the Frame Rate includes a Pull and Push duration, which directly correspond to BIPS' overhead, but it also includes a Processing duration (labeled Production or Consumption in the diagram) and an Inter Iteration duration. These will vary according to the use case. We provide performance results for cases that minimize the Processing and Inter Iteration durations, as well as cases that might simulate a realistic exchange of image buffers between clients.
Bandwidth
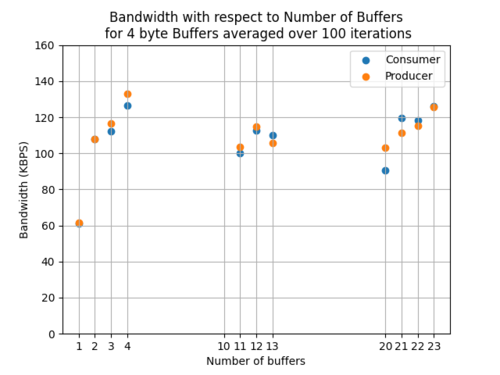
We measure the Bandwidth in Bytes Per Second (BPS) as the number of bytes that are exchanged between clients in a second. To obtain the Bandwidth, we multiply the Buffer Size and the Frame Rate, as well as a factor of 2 to account for the Pull - Push exchange from Producer to Consumer, and the Pull - Push exchange from Consumer to Producer.
Latency
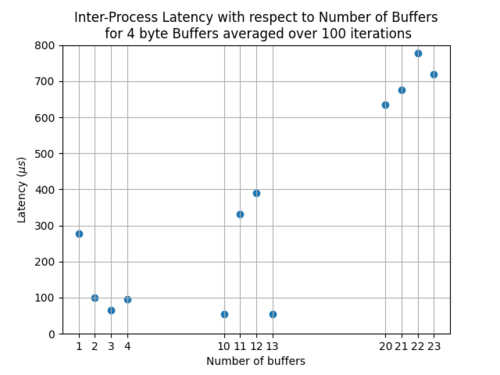
We measure the Inter-Process Latency as the delay between the Production Cycle and the Consumption Cycle as shown in the diagram. To capture this metric, the Producer attaches a timestamp to the Buffer at the time of Production, and then the Consumer reads the timestamp during the time of Consumption. The Consumer then takes a timestamp difference between the time of Consumption and the time of Production as measured in the Buffer timestamp.
Results
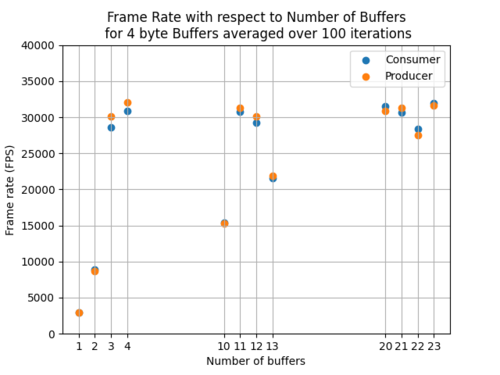
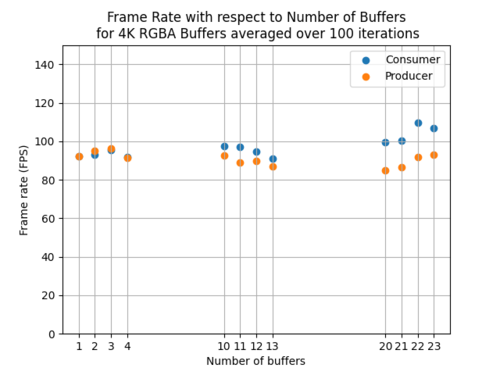
Here we plot the Frame Rate, Bandwidth and Latency as a function of the number of buffers we use in each test. Each test runs for at least 100 iterations. The metrics are then averaged across the different iterations.
Using 4 byte Buffers
To reduce the Processing and Inter Iteration overhead, we exchange small, 4 byte Buffers.
Using 4K RGBA Buffers =
To simulate a relatively demanding use case, we exchange 4K RGBA Buffers.
