I.MX8 Deep Learning Reference Designs - Restricted Zone Detector Reference Design
I.MX8 Deep Learning Reference Designs RidgeRun documentation is currently under development. |
|
| i.MX8 Deep Learning Reference Designs | |
|---|---|
| Getting Started | |
|
|
|
| Project Architecture | |
|
|
|
| Reference Designs | |
|
|
|
| Customizing the Project | |
|
|
|
| Contact Us | |
|
|
Contents
Introduction
The following section provides a detailed explanation and demonstration of the various components that make up this reference design called "Restricted Zone Detector" (RZD). The goal of this application is to demonstrate the operation of the I.MX8 Deep Learning Reference Designs, through the development of an application that works for monitoring people in a restricted zone area. The application context selected, is just an arbitrary example, but in this way, you can check the capabilities of this project, and the flexibility offered by the system to be adapted to different applications that require IA processing for computer vision tasks.
System Components
Next, an explanation of the main components that make up the RZD application will be provided. As you will notice, the structure of the system is based on the design presented in the High-Level Design section, reusing the components of the main framework and including custom modules to meet the business rules required by the context of this application.
Camera Capture
Class Diagram
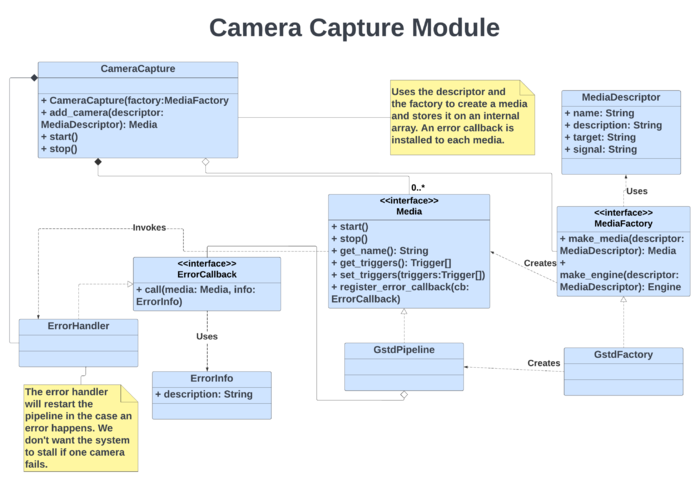
Below is the class diagram that represents the design of the Camera Capture subsystem for the RZD application.
Media Entity
For handling the media, RZD relies on the use of the methods provided by the Python API of GStreamer Daemon. This library allows us to easily manipulate the GStreamer pipelines that transmit the information received by the system's cameras. In this way, the Media and Media Factory entities are used to abstract the methods that allow creating, starting, stopping, and deleting pipeline instances. In addition, the parking system uses three cameras that transmit video information through the Real-Time Streaming Protocol (RTSP). Each of these cameras represents the entrance, exit, and parking sectors of the parking lot system. The video frames received from the three cameras are processed simultaneously in the DeepStream pipeline, which is in charge of carrying out the inference process. To do this, the media are described using the GstInterpipe, which is a GStreamer plug-in that allows pipeline buffers and events to flow between two or more independent pipelines.
AI Manager
Class Diagram
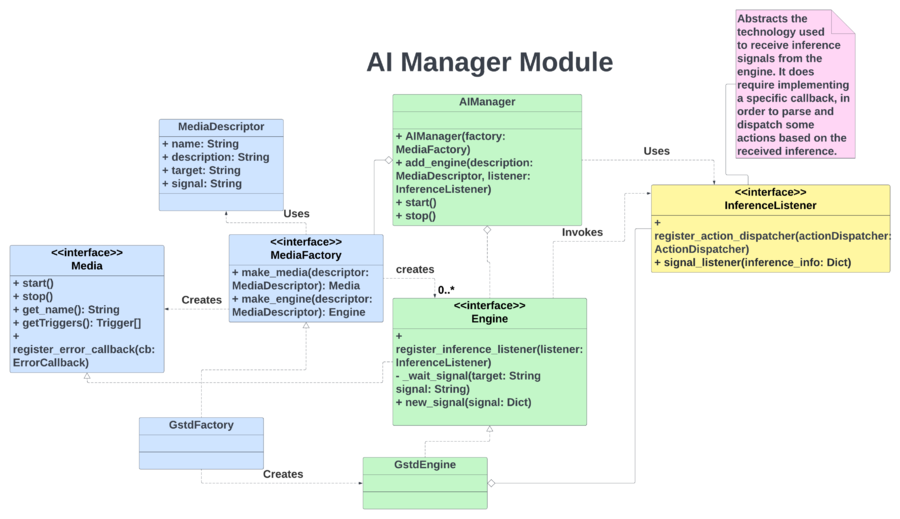
Below is the class diagram that represents the design of the AI Manager for the RZD application. As can be seen in the diagram, the AI Manager bases its operation on the entity called engine, which is an extension of the media module used by the Camera Capture subsystem. This extension allows the media entity to handle the inference operations required for the application. Also, the media descriptor for the engine abstracts the components of the GstInference Pipeline.
Inference Model
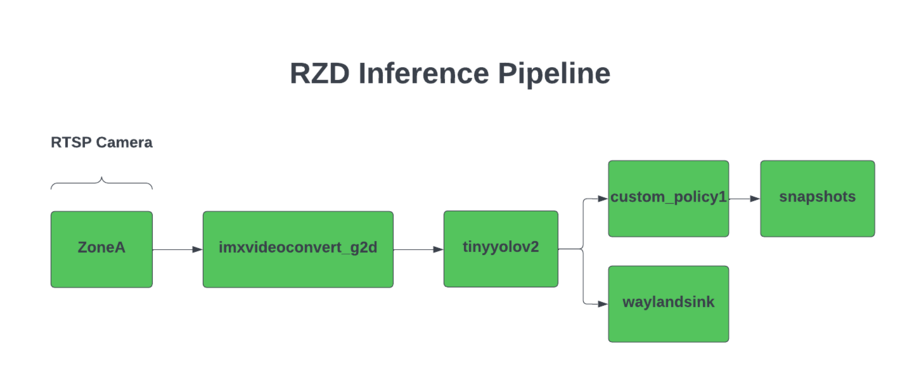
The following figure shows the general layout of the inference pipeline used by the RZD application. For simplicity of the diagram, some components are excluded to give emphasis to the most important ones.
As can be seen in the pipeline, the input information comes from a RTSP camera used by the Restricted Zone Detector system. These data is received by the i.MX video convert plugin with HW acceleration imxvideoconvert_g2d . Then the inference process starts, where RZD relies on the use of the the model shown in the pipeline, which is:
- TinyYoloV2 Model: TinyYOLO (also called tiny Darknet) is the light version of the YOLO (You Only Look Once) real-time object detection deep neural network. TinyYOLO is lighter and faster than YOLO while also outperforming other light model's accuracy.
Once the inference process has been carried out, the information obtained can be displayed graphically with the waylandsink plugin, and in the case of RZD, the metadata is sent to a custom policy that allows us to take snapshots every time there is a person in the restricted zone. It is out of the scope of this Wiki to provide a more detailed explanation of each of the components shown in the RZD inference pipeline.
Inference Listener
In the case of the inference listener, the RZD application receives the inference information from the signal_connect pygstc.gstc method module. Basically, this method is always listening to the target element in the pipeline and waiting for the information given by the signal. In our case, the information given by the signal corresponds to the inference process done by the neural network model used. The inference listener will be in charge of sending the inference information to the policy and actions. So, this element can be seen as a passthrough function that passes the inference information, without any modification, to the policies and actions.
Actions
The following actions are available to the user of the RZD application. Although the actions are specific to the restricted zone context, they could be adapted for use in other designs, so these ideas can serve as a basis for different projects.
- Stdout Log: This action represents printing relevant information on the processed inferences to the system's terminal, using the standard output. This information can serve as a kind of runtime log about what is happening in the restricted zone. An example of the information format shown in the standard output is as follows:
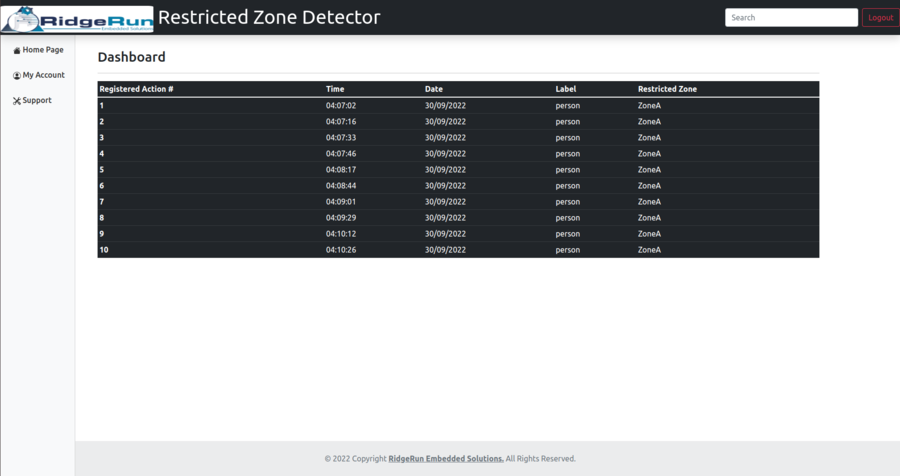
A person was detected at 17:30:44 hours in sector ZoneA on the day 30/09/2022.- Dashboard: The dashboard action is very similar to the Stdout Log in terms of the content and format of the information it handles. The difference is that in this case, the information is not printed on the terminal using the standard output but is sent to a web dashboard, using an HTTP request to the API that controls the operations where the web dashboard is located. The RZD application provides an API and a basic design that represents the web dashboard that an administrator of this restricted zone detector would use. Later, in the Additional Features section of this wiki, you can find more information about the implementation of this web dashboard.
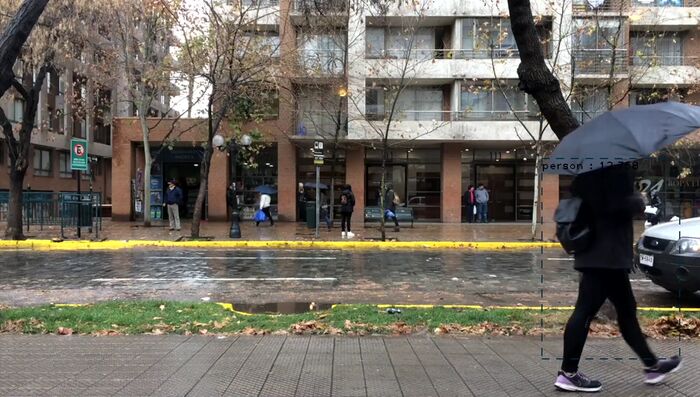
- Snapshot: What this action seeks is to create a snapshot, of the flow of information that the media pipeline in question is transmitting. Like the other ones, this action is linked to the camera on which the business rules (policies) will be applied, and eventually, they will activate the execution of the corresponding task, depending on certain conditions. The snapshot will be stored in an image file in "jpeg" format and with the generic name "snapshot_RestrictedZone_Date_Time.jpeg". The path where the image will be stored can be entered as a configuration parameter of the rzd.yaml file. The following figure shows an example of a snapshot captured during the execution of the application using some sample videos of people walking in the street. In this case, the snapshot was triggered because a person was detected in the area of the camera assigned as a restricted area.
Important Note: Remember that if you want a more detailed explanation of what are actions in the Deep Learning Reference Designs project, including visualization of their class diagrams with code examples, we recommend reading the sections of
High-Level Design and Implementing Custom Actions. |
Policies
The following policies are available to the user of the RZD application. Given the nature of policies, the examples shown depend on the context of a restricted zone area. RZD uses a monitoring system with one camera with multiple restricted areas, by now, the RZD application only provides support for only one restricted area. So the policy explained below is based on the inferences received through the restricted area, to apply the required business rules.
- Person Detected Policy: This policy is responsible for determining the exact moment when a person enters a restricted area. Once the logic of the policy has established that the mentioned condition is met, the previously explained actions can be executed, where the user can see information about which restricted zone trespassed, with its respective date and hour.
Important Note: Remember that if you want a more detailed explanation of what are the policies in the i.MX8 Deep Learning Reference Designs project, including visualization of their class diagrams with code examples, we recommend reading the sections of
High-Level Design and Implementing Custom Policies. |
Config Files
Configuration files allow you to adjust the required parameters prior to running the application. Each one serves a specific purpose, depending on the component it references, and they are all located in the project's config files directory. Although RZD provides a base configuration, you are free to change the parameters that you consider necessary, however, you must make sure that the parameters that you are going to modify are correct and will not cause a malfunction of the system. If you have questions or problems during your experiments with the configuration parameters, you can contact our Support team.
RZD Config
RZD provides a general configuration file in YAML format. This file has different sections that are explained below. Initially, we have a Gstreamer Daemon or Gstd configuration section. The parameters that can be entered include the IP address and the port where the service will be launched.
gstd:
  ip: "localhost"
  port: 5000
Next, this section shows how the cameras that send the information through the RTSP protocol are configured. The label used in this section is "streams", and through this information, RZD is responsible for generating the respective media instances. Each stream has a unique identifier, the URL of the RTSP stream, and the triggers that will be activated on each one.
streams:
  - id: "ZoneA"
    url: "rtsp://127.0.0.1:8554/stream"
    triggers:
      - "trespassing"
In the next part, it is where you can configure the parameters that the system policies will use. The application logic knows how to interpret this information, to build the respective policies. The threshold value and the category will be contrasted with respect to the values generated during the inference process, in this way the received metadata can be filtered depending on the application requirements, also, the points parameter gives the capability to select where is located the restricted zone.
policies:
  - name: "person_detected_policy"
    categories:
      - "person"
    threshold: 0.08
    points:
      - [0.60, 0.0]
      - [0.87, 0.0]
      - [0.87, 0.42]
      - [0.60, 0.42]
As its name indicates, this section is where the actions that RZD can use are determined, in case the assigned policies are activated. For the dashboard action, it is necessary to indicate the URL of the API where the web page is hosted, in order to establish the respective communication. And in the case of the snapshot action, the user can indicate the path where the generated image file will be stored.
actions:
  - name: "dashboard"
    url:  "http://127.0.0.1:4200/dashboard"
  - name: "stdout"
  - name: "snapshot"
    path: "/tmp/"
Finally, there is the section where the system triggers are configured. Each trigger is made up of a name, a list of actions, and policies. The name of the trigger is the one assigned to each configured stream so that the defined policies will be processed, and if activated, the installed actions will be executed on each stream.
triggers:
  - name: "trespassing"
    actions:
      - "dashboard"
      - "snapshot"
      - "stdout"
    policies:
      - "person_detected_policy"
Supported Platforms
The RZD application offers support for the NXP i.MX8MPLUS platform. However, this does not limit that the project can be ported to another platform, it is simply that the provided configuration files cover parameters that were tested on that specific platform. As explained previously in this Wiki, RZD relies on the use of the tinyyolov2 model to carry out the inference process, after that the information of the inference is displayed with the waylandsink plugin and the metadata is sent to the snapshot action when a person is inside the restricted zone.
Additional Features
Web Dashboard
RZD provides within its features a Web Dashboard, which can be used by the security system administrator, to check in real-time the logs generated with information of the date, time, and the restricted zone where the person was detected. The Dashboard as such consists of a table that shows each registered action, the time, the date and the restricted zone where the report was generated. To configure the operation of this Web Dashboard, it is necessary to modify the parameters of the Dashboard action located in the rzd.yaml configuration file. For instructions on how to run this Web Dashboard, you can refer to the Evaluating the Project section. The following figure shows an example of what the Web Dashboard looks like, taking as a sample a sequence of vehicles in a parking lot.
Important Note: This functionality of the Web Dashboard serves as an example to demonstrate possible ways in which the user can take advantage of the information generated as a result of the inference, in their own designs or applications. This Web Dashboard does not constitute a Web page with full navigation features, it simply represents the use of the Dashboard. |


