GstShark - CPU usage tracer
Open-source project from Ridgerun. |
| GstShark |
|---|
| Getting Started |
| Generating trace files |
| Tracer Parameters |
| Available Tracers |
| Results |
| Visualization Tools |
| Examples |
| Contact Us |
The CPU usage tracer measures the load on the CPU at the time of running a determined pipeline. This gives the user a way of knowing immediately if the host system is capable of running the pipeline without overcharging the cores of the CPU. It is important to mention that the measurements displayed every second by the tracer correspond to the total load of the CPU and it is not the exact data of the load caused by the pipeline at the time of running it. However, the measurements made and printed on the output log give a good idea of how the load of the CPU is behaving at the time of running the pipeline. With this information, it is possible to check if the pipeline produces an unexpected and undesired increase of the load of the CPU that could cause a failure on the system or a failure of the pipeline due to lack of resources.
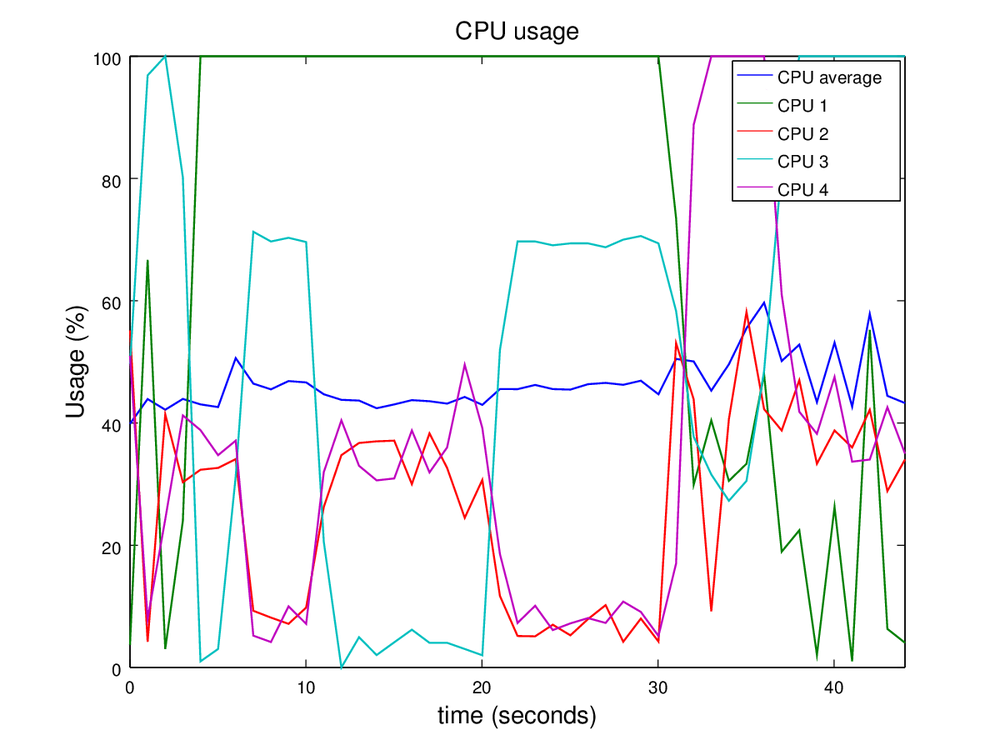
The CPU usage tracer has the capability of measuring every core of the system. In a multiprocessor system, the output log will include a load of each individual core, giving an idea of the effect that the pipeline has on the total CPU consumption on the system.
Currently, this tracer is only available for GNU/Linux based systems, since the method used to determine the load on every core available is by reading the /proc/stat file. Windows and Mac systems do not support this method, so are not supported. The GstShark tracers check the Operating System of the host in which it is running and depending on this it will disable the CPU usage tracer if it is needed, preventing the user from dealing with unnecessary errors.
The CPU usage tracer has no limitation with using elements of any category.
Contents |
|
Graph
Pipeline
The following pipeline provides a guide for the usage of the CPU usage tracer and the results obtained. It provides the CPU usage, regardless of the elements of the pipeline. In this example, there are elements of all categories available.
$ GST_DEBUG="GST_TRACER:7" GST_TRACERS="cpuusage" gst-launch-1.0 videotestsrc ! 'video/x-raw, format=(string)YUY2, width=(int)640, height=(int)480, framerate=(fraction)30/1' ! videorate max-rate=30 ! videoconvert ! queue ! avenc_h263p ! queue ! avimux ! fakesink sync=true
Output
0:00:14.941266921 20322      0x15c5400 TRACE             GST_TRACER :0:: cpuusage, number=(uint)0, load=(double)7.000000;
0:00:14.941324948 20322      0x15c5400 TRACE             GST_TRACER :0:: cpuusage, number=(uint)1, load=(double)7.000000;
0:00:14.941396919 20322      0x15c5400 TRACE             GST_TRACER :0:: cpuusage, number=(uint)2, load=(double)7.000000;
0:00:14.941420125 20322      0x15c5400 TRACE             GST_TRACER :0:: cpuusage, number=(uint)3, load=(double)8.080808;
0:00:14.941441788 20322      0x15c5400 TRACE             GST_TRACER :0:: cpuusage, number=(uint)4, load=(double)6.122449;
0:00:14.941461533 20322      0x15c5400 TRACE             GST_TRACER :0:: cpuusage, number=(uint)5, load=(double)11.000000;
0:00:14.941485901 20322      0x15c5400 TRACE             GST_TRACER :0:: cpuusage, number=(uint)6, load=(double)8.000000;
0:00:14.941507391 20322      0x15c5400 TRACE             GST_TRACER :0:: cpuusage, number=(uint)7, load=(double)8.163265;
For each line in the output log, the tracer provides a number field that identifies the core number and a load field that identifies the core's load at the time. The test run shown in the output was done using an 8-core processor, so cores from 0 to 7 are listed.
Plot

