GstShark - Eclipse plugin
Open-source project from Ridgerun. |
| GstShark |
|---|
| Getting Started |
| Generating trace files |
| Tracer Parameters |
| Available Tracers |
| Results |
| Visualization Tools |
| Examples |
| Contact Us |
This plug-in is no longer supported and we no longer recommend using it. Instead, consider using the simple plotting scripts provided in the project. |
An experimental Eclipse plugin is provided to facilitate the task of analyzing the data obtained through the GstShark tracers. The Eclipse plugin is really helpful for processing and providing a more understandable and intuitive representation of the data so it can be easier to interpret than the console output log or the output file written in CTF format. However, the Eclipse plugin still needs to access the output log in a CTF format, generated by the tracer itself.
The GstShark Eclipse plugin is a feature of the application for simplifying the operation of reviewing the results obtained by means of a more friendly interface than the console output log and the possibility of generating plots of the measurements. This guide assumes that the plugin has been successfully installed in Eclipse. The instructions of how to install the plugin are provided in the plugin install page.
Contents
Limitations
The experimental GstShark Eclipse plugin currently only supports plotting the results of the cpuusage and framerate tracers. RidgeRun is working on developing more functions in order to add support for the remaining tracers. Support for more plots is currently provided using the gstshark-plot scripts.
Support is currently limited to Eclipse Mars.2. Later versions like Neon and Oxygen are not yet supported.
Sample pipeline
For this document, the result of running the following pipeline is used.
GST_DEBUG="GST_TRACER:7" GST_TRACERS="graphic;cpuusage;framerate" gst-launch-1.0 videotestsrc num-buffers=500 ! 'video/x-raw, format=(string)YUY2, width=(int)640, height=(int)480, framerate=(fraction)30/1' ! videorate max-rate=30 ! videoconvert ! queue ! avenc_h263p ! queue ! avimux ! fakesink sync=true
Loading the trace results
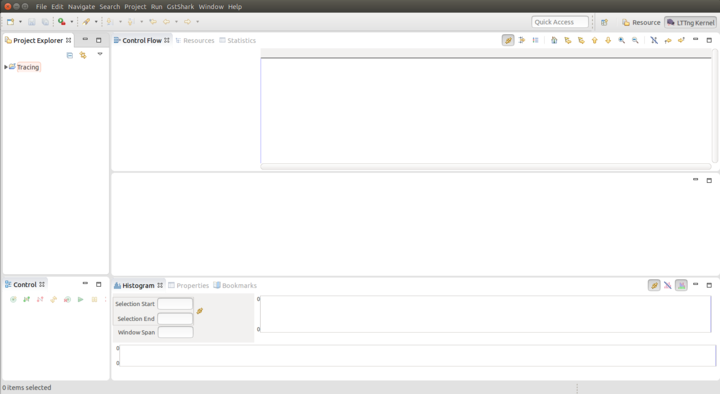
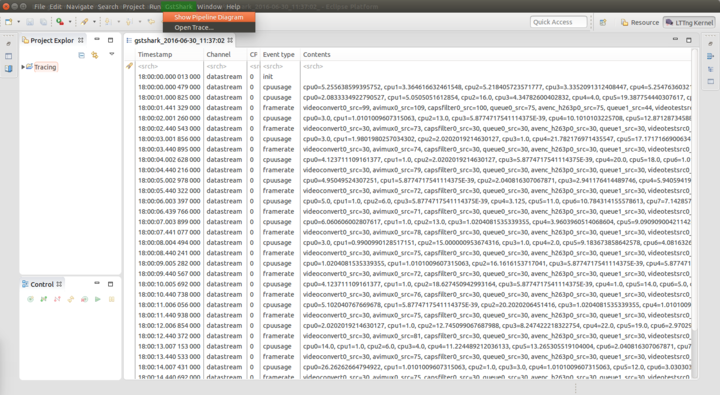
Once the previous pipeline has been run and the output files have been saved in a known path, open Eclipse. If the installation of the plugin was successful, the interface should look like the following image.
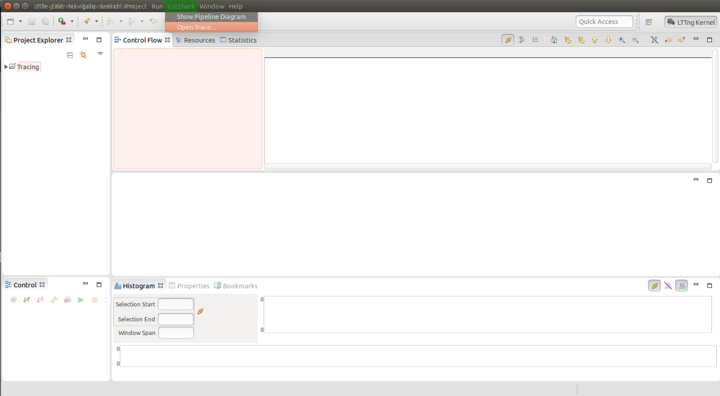
Next, open the trace file and load the results. Use the option "GstShark->Open Trace" as shown in the following image.
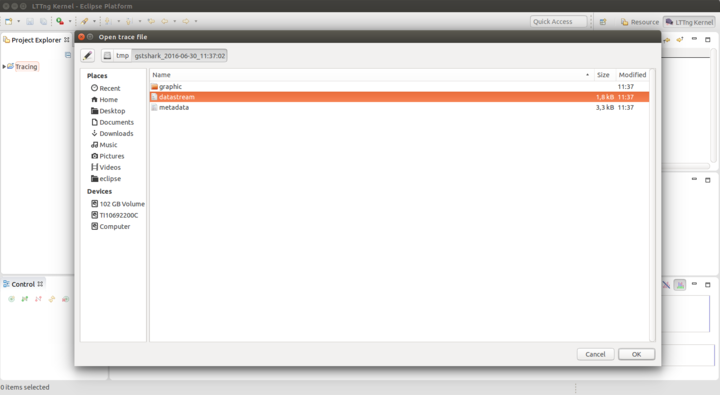
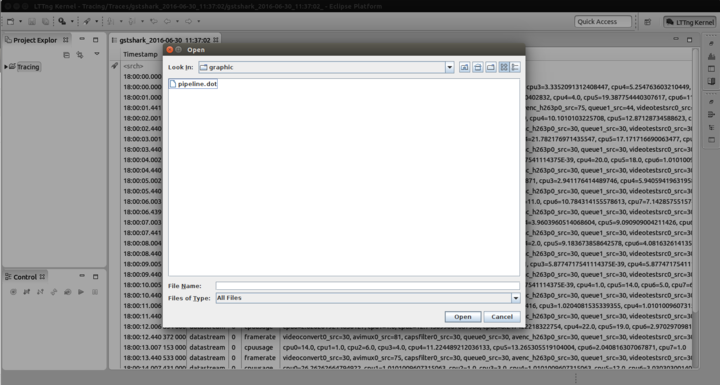
Pick the file in the "Open" window from the directory where the trace files are stored. Select the "datastream" file so the plugin can successfully load the results gathered.
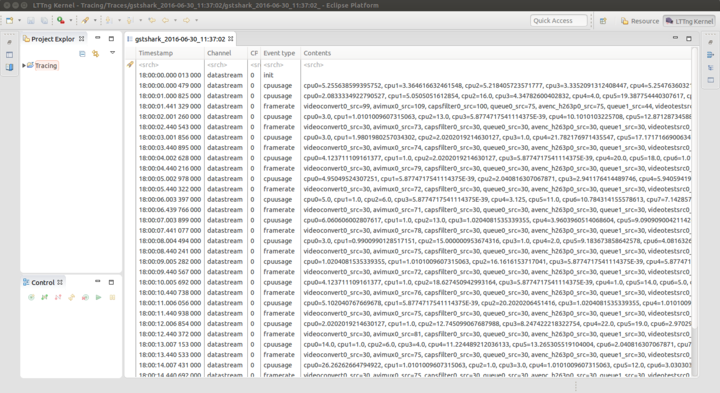
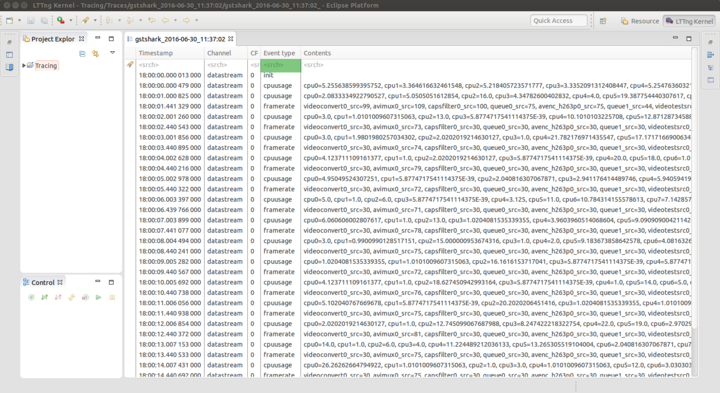
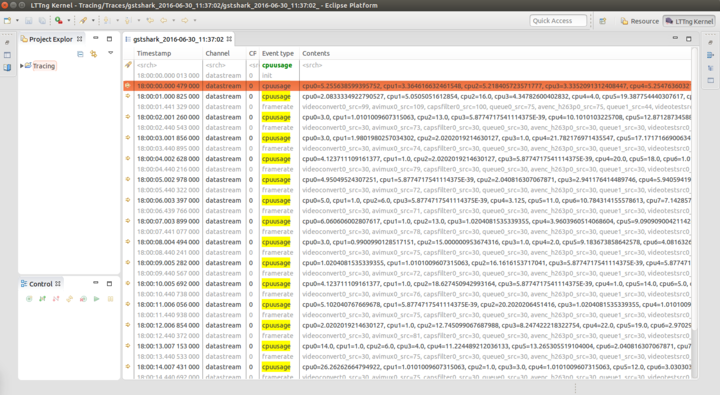
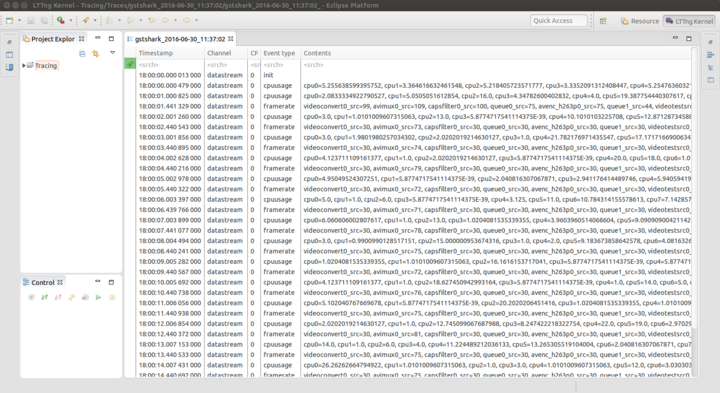
Once the "datastream" file was successfully loaded the user should expect to see something similar to the following image, in which the results of every tracer run with the pipeline are shown by category. For the current example, the tracers enabled were the "cpuusage" and "framerate" tracers.
Viewing the pipeline diagram
One of the features that the GstShark Eclipse plugin has is the capability of showing the graphical diagram of the pipeline run; as it was explained in the previous section, adding the "graphic" tracer to the execution of the pipeline will export the diagram of it to an additional folder inside the selected path, the one in which the output files are being saved, in DOT format. The Eclipse plugin allows opening the file using the "GstShark->Show Pipeline Diagram" menu.
Pick the DOT file in the "Open" window from the directory where the graphic files are stored.
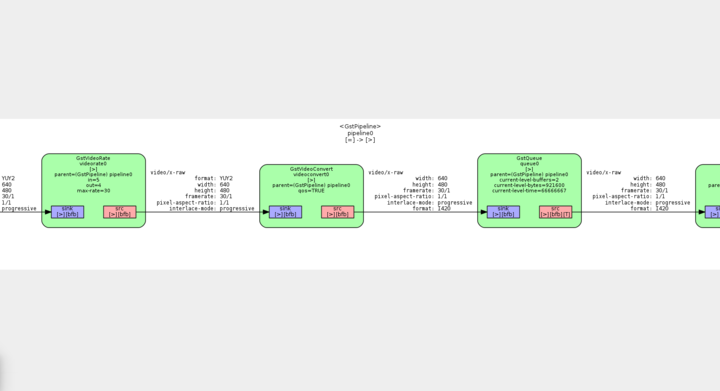
When the DOT file is opened, the plugin will convert the format of the file to a regular image format, e.g. PNG, JPEG, among others. It will show the output image diagram to the user on a new window. It is important to mention that the GstShark plugin has a known issue related to this feature and it is specifically related to the size of the window opened; if the pipeline diagram is too big the window will crop it on the edges showing only what fits the size of the window. Extending the size of the window will allow the user to see more of the pipeline diagram but there is no way to make it smaller (zoom in and zoom out functions are not supported yet) and therefore the pipeline diagram will always appear cut as the following image shows.
For more options on how to handle the DOT files, refer to the Pipeline Diagram page.
Manipulating the trace files
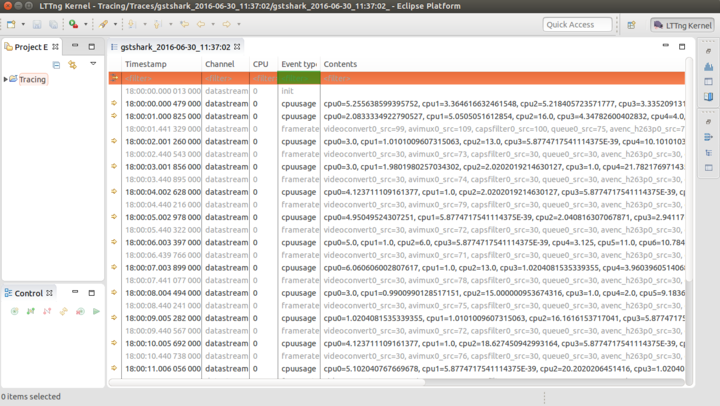
Another feature available through the GstShark Eclipse plugin is the capability of searching and filtering the results obtained by the tracers that generated them. This is useful when the user has interests in checking the behavior of a specific parameter but because of time or resources, the pipeline was run with several tracers at the same time. This feature can be accessed by typing the search parameter on the top of the column "Event type" as it is shown on the following image.
Searching
As a demonstration of the search capability of the GstShark Eclipse plugin, the following image shows the output obtained by searching the value "cpuusage" with the instructions explained before.
To clean the search results, erase the search parameter and this will undo the search.
Filter
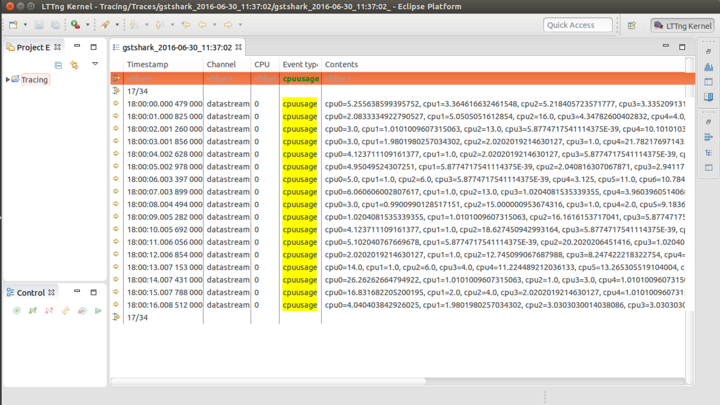
Filtering the output results is also a feature available on the GstShark Eclipse plugin and it is a very simple process very similar to the one used for searching a specific "Event type". However, in order to access the filtered results, the user first needs to change the mode of operation and this is done by toggling the icon marked on the following image; this icon has no legend but it is pretty simple to distinguish when the icon is similar to a lantern with the light on is because the GstShark Eclipse plugin is on searching mode and when the icon is three rows pointing to the right is because the GstShark Eclipse plugin is on filtering mode.
The method used to introduce the filter parameter is similar to the one used to insert the search parameter since it is only needed to type the specific parameter that is going to be used for filtering in the "Event type" field as it is marked on the following image.
In order to demonstrate the filtering feature that GstShark Eclipse plugin has, the following image shows the output obtained by filtering the value "cpuusage" with the instructions explained before.
To clean the filter results, make sure to right-click on the filter and select the option "Clear filters", otherwise, the data will remain filtered even when the filter parameter has been removed.
Plotting the trace results
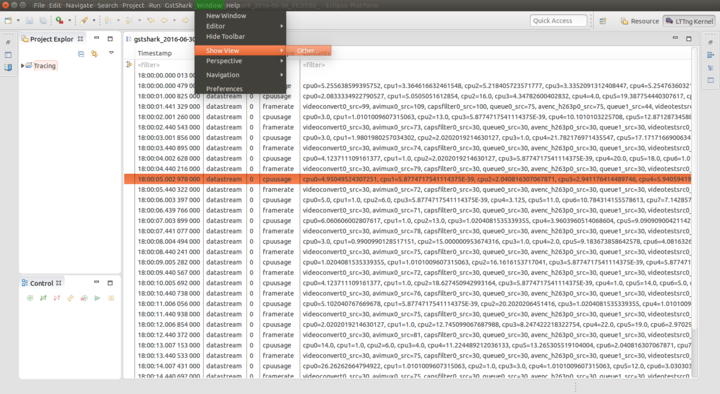
The main feature of the GstShark Eclipse plugin is the plotting of the traced values in time. The information used to make these plots is filtered automatically by the GstShark Eclipse plugin which means that the only step that the user has to do is to open a new window in which the plot can be shown. Use the "Window->Show view->Other..." menu, as shown in the following image.
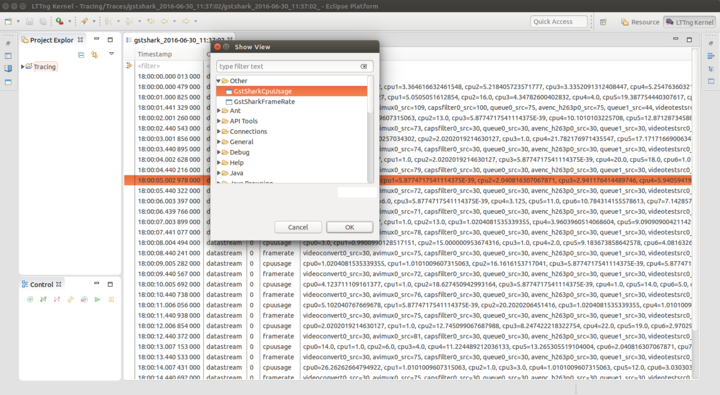
A small list of the options should appear, showing the many options of the type of windows available to be opened on the GstShark Eclipse plugin. The GstShark plots are categorized under the name "Other" as it is shown on the following image where the two kinds of plots available appear on the top of the list.
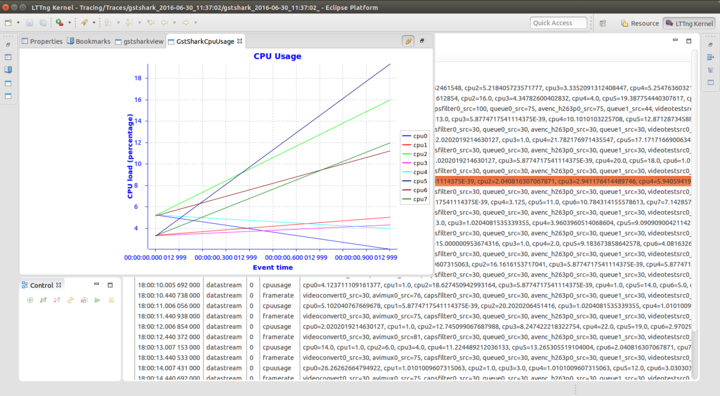
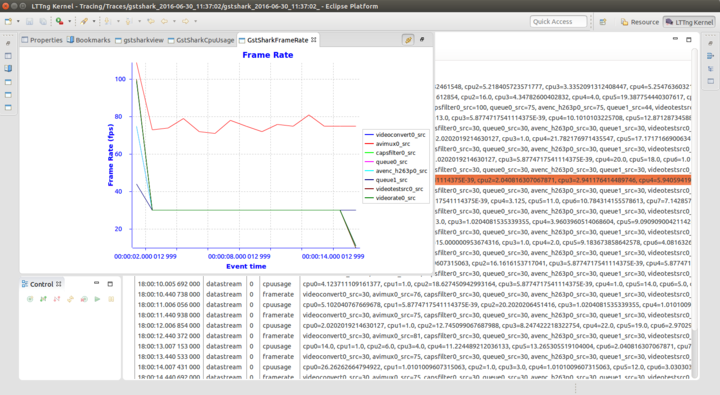
Select "GstSharkCpuUsage" or "GstSharkFrameRate", according to the type of plot required. Some samples of the results are shown below.
Since the GstShark Eclipse Plugin is in an experimental stage, in some cases the graph appears to be empty but really there is only an issue with the time scale of the X axis. To fix this, zoom out and the plot will appear eventually.
CPU Usage plot
Frame rate plot
