GstShark - Processing Time tracer
Open-source project from Ridgerun. |
| GstShark |
|---|
| Getting Started |
| Generating trace files |
| Tracer Parameters |
| Available Tracers |
| Results |
| Visualization Tools |
| Examples |
| Contact Us |
Processing time was developed with the purpose of providing useful information to the user about the time each element of a given pipeline takes processing each data buffer that goes through it. This allows the user to measure the performance of each element of the pipeline. This tracer was developed to help the user determine which element or process is increasing the general latency of the pipeline. It is a tool to check which element takes too much time completing its tasks, causing a slow performance of the pipeline which can lead to a delay on the buffers. This kind of delay can affect audio-video synchronization, for example.
The processing time tracer is designed to providing accurate data for the filter and filter-like elements of the pipeline. The tracer measures the time an element takes to generate an output buffer when it receives a buffer on its sink pad. Only elements that have both input and outputs pads are measured. Thus, the source and sink elements are not measured by this tracer.
In the filter elements, supported by this tracer, an input buffer produces an output buffer, as a video converter. The filter-like elements are more complex elements in which several input buffers combine to produce an output buffer (like an encoder or a muxer) or where a single input buffer produces several output buffers (like a demuxer or a decoder), regardless of the amount of source and sink pads that the element has. However the tracer has the limitation that it only can report times for elements which process the inputs and outputs in the same thread, since the tracer displays a general measurement of the time elapsed processing a buffer without knowing the operation of element in detail.
Contents |
|
Graph
Pipeline
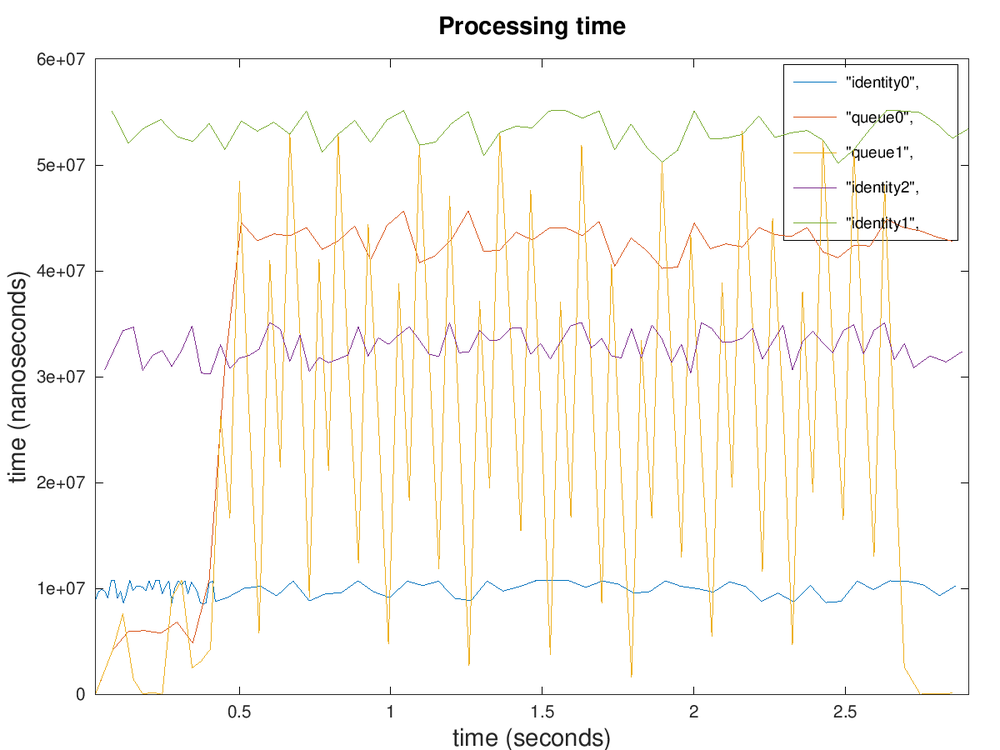
The following pipeline demonstrates how to use the processing time tracer and the results obtained with it. Identity elements with a delay set are used to simulate an increased processing time by an element. This forced delay should be reflected on the measurements for every element on the output log of the tracer.
$ GST_DEBUG="GST_TRACER:7" GST_TRACERS="proctime" gst-launch-1.0 videotestsrc ! identity sleep-time=8500 ! tee name=t t. ! queue ! identity sleep-time=50000 ! fakesink t. ! queue ! identity sleep-time=30000 ! fakesink
Output
0:00:03.064150969 13190      0x1511720 TRACE             GST_TRACER :0:: proctime, element=(string)identity0, time=(string)0:00:00.008593923;
0:00:03.085515606 13190      0x165f680 TRACE             GST_TRACER :0:: proctime, element=(string)identity2, time=(string)0:00:00.030146650;
0:00:03.105485969 13190      0x165f4a0 TRACE             GST_TRACER :0:: proctime, element=(string)identity1, time=(string)0:00:00.050150374;
Each line of the log includes an element field identifying the element and the time field with the processing time it took to run a buffer through the element. The output log only shows the identity elements. This is because, as it was mentioned before, the processing time only works for filter and filter-like elements. There are no results for the videotestsrc, the tee or the fakesinks. The queue element is a filter element as well, but it processes the buffers in different threads, so it is not supported by the processing time tracer.
Plot

