Birds Eye View Performance Profiling
| Birds Eye View |
|---|
 |
| Introduction |
| Getting the Code |
| Getting Started |
| Examples |
| Library Docs |
| Performance |
| Contact Us |
Contents
Application Profiling
The library supports application profiling as a developer-oriented feature using gperftools.
GPerfTools Installation
Install the library packages from GitHub repository
git clone https://github.com/gperftools/gperftools
cd gperftools
./autogen.sh
./configure
make
sudo make install
On Debian-based systems, the complementary tools are packaged under the google-perftools package. For graphical output you also need Graphviz installed:
sudo apt-get install google-perftools graphviz
Note that all the tools have the “google-” prefix under debian - the prefix may be missing on other systems (and is also missing in the official documentation).
BEV examples profiling
To enable profiling execute meson and compile the library with the following option:
meson -Dprofiling=enabled ..
ninja
A) Profile the whole process runtime
1. To start profiling run:
LD_PRELOAD: Path to the libprofiler.so usually located at /usr/local/lib/
CPUPROFILE: Name of the output log file
LD_PRELOAD=/usr/local/lib/libprofiler.so CPUPROFILE=test.prof ./path/to/bin
2. Keep the application open or running until it finishes, in this mode if the execution is canceled for example with Ctrl+C the output file will not be generated.
3.1 Once the application ended the test.prof file contains the CPU profile information. To get a graphical output run:
pprof -gv ./path/to/bin test.prof
3.2 Also as an alternative viewer you can display it to a web browser by running:
pprof --web ./path/to/bin test.prof
4. To generate a PDF report with the previous graphic output run:
pprof --pdf ./path/to/bin test.prof > output.pdf
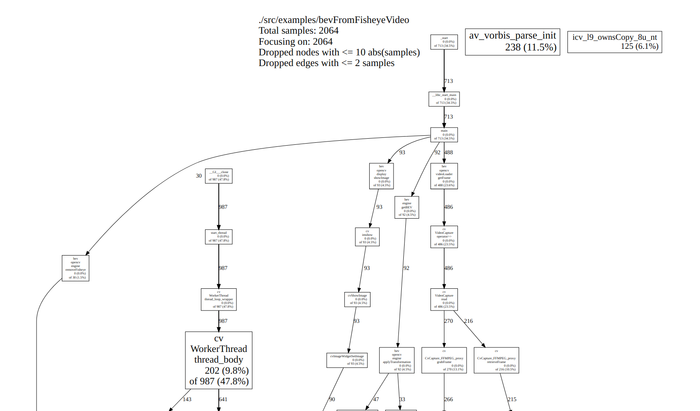
Example graphical output:
B) Profile part of process runtime
In addition to defining the environment variable CPUPROFILE you can also define CPUPROFILESIGNAL. This allows profiling to be controlled via the signal number that you specify. The signal number must be unused by the program under normal operation. Internally it acts as a switch, triggered by the signal, which is off by default.
1. To start profiling run:
LD_PRELOAD=/usr/local/lib/libprofiler.so CPUPROFILE=test.prof CPUPROFILESIGNAL=12 ./path/to/bin
2. Leave the program running until you want to start the profiling process. Then send the signal:
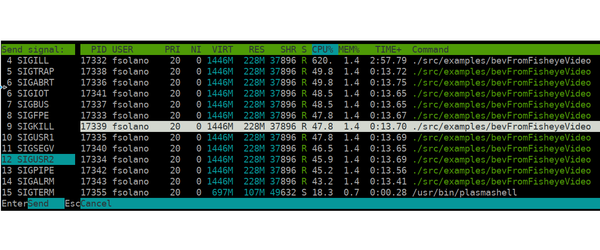
2.1 You can use htop program to send the signal to the desired process:
2.1 Also you can use killall command to send the -12 signal
killall -12 /path/to/bin
3. Leave the program until the point you want to profile it, then run again:
killall -12 /path/to/bin
You will notice the following output when the output file was correctly generated:
Using signal 12 as cpu profiling switch
PROFILE: interrupts/evictions/bytes = 4773/1826/231936
4. Once the application ended the test.prof.0 file contains the CPU profile information. To get a graphical output run:
pprof -gv ./path/to/bin test.prof
C) Profile specific section of source code
1. Add the header file in your code:
#include <gperftools/profiler.h>
2. Add the following functions calls around the code you want to profile:
ProfilerStart("output_inside.prof"); //Start profiling section and save to file

/*
* Code to be analyzed
*/

ProfilerStop(); //End profiling section
3. Run the test application, where you will an output similar to the following:
fsolano@ridgerun-laptop:build$ ./test
PROFILE: interrupts/evictions/bytes = 9/0/280
PROFILE: interrupts/evictions/bytes = 7/0/584
PROFILE: interrupts/evictions/bytes = 12/0/872
PROFILE: interrupts/evictions/bytes = 9/0/712
PROFILE: interrupts/evictions/bytes = 9/0/904
PROFILE: interrupts/evictions/bytes = 7/0/464
PROFILE: interrupts/evictions/bytes = 8/0/680
4. With this method you can wait until the application execution ends, or end it with Ctrl+C.
5. Once the application ended the output_inside.prof file contains the CPU profile information. To get a graphical output run:
pprof -gv ./test output_inside.prof

